

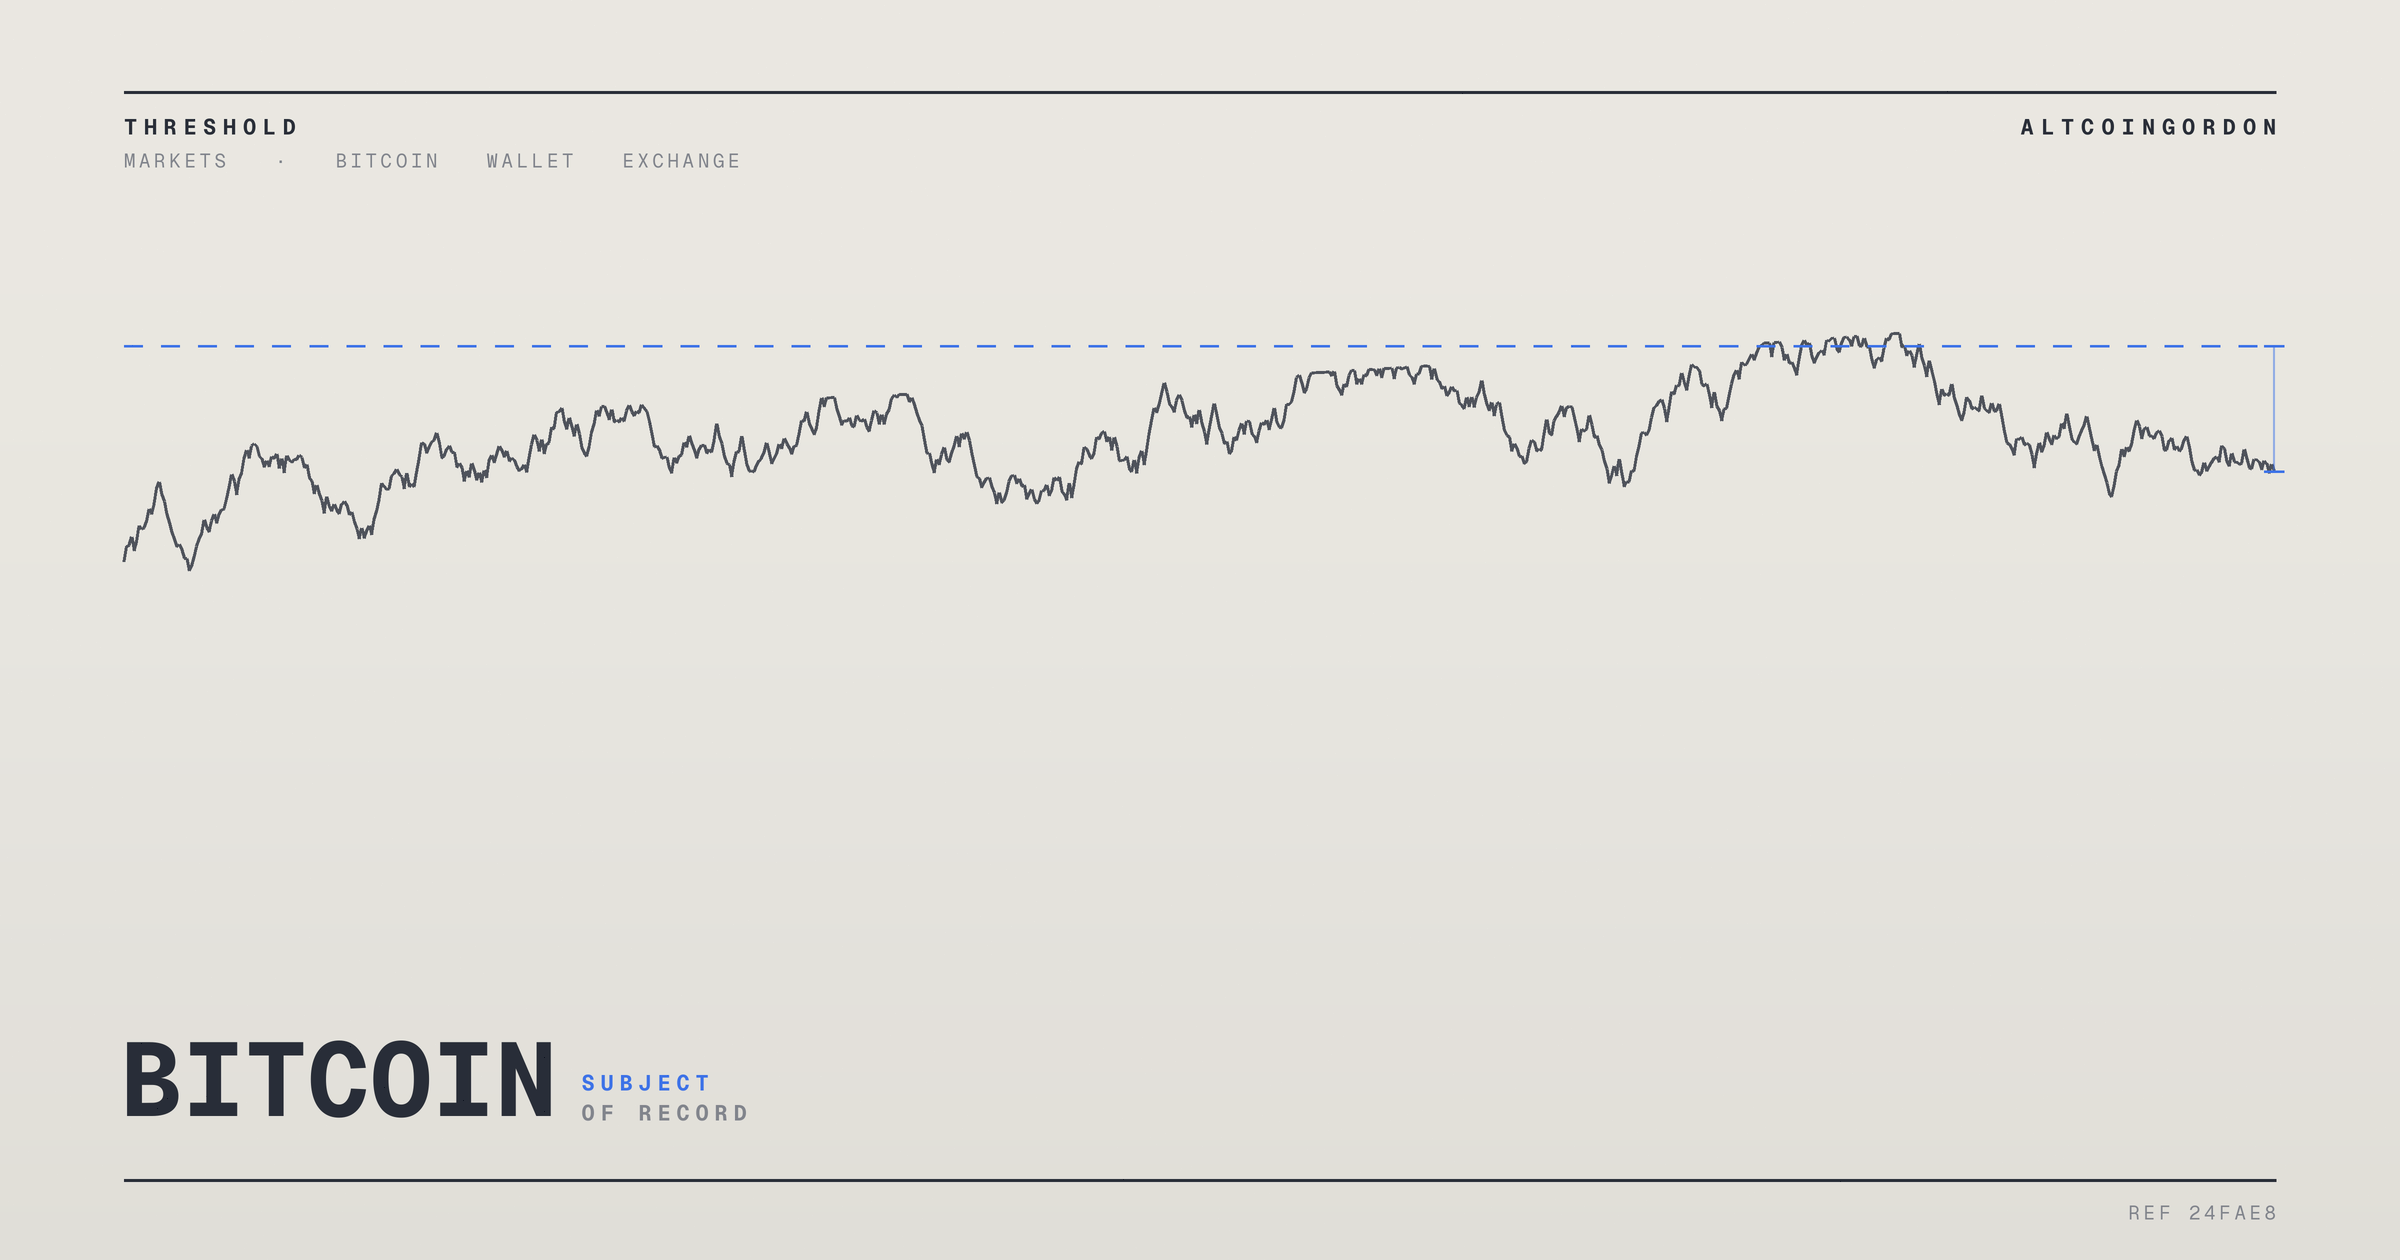
Bitcoin’s daily active address count has fallen to a level not seen since the 2018-19 bear market, CryptoBriefing reported. The metric tracks the number of unique wallet addresses participating in transactions on a given day. A sustained drop in this figure typically signals reduced network usage and waning short-term speculative interest.
Analysts cited in the report say the current reading echoes patterns observed near the end of previous downturns. In both the late 2018 and early 2019 periods, active address counts bottomed out before Bitcoin’s price began a broader recovery. That historical parallel is why some on-chain researchers view the latest data as a potential early signal of stabilization, rather than a sign of deepening weakness.
Active address counts are widely used in on-chain analysis because they offer a rough proxy for organic network demand, separate from price action alone. When addresses fall alongside price, it can suggest that casual traders and short-term speculators have exited the market. Analysts often argue that this kind of shakeout, sometimes described as capitulation, has historically preceded periods of consolidation or recovery.
The metric is not without limitations. Address counts can be distorted by exchange batching, custodial wallet structures, and changes in how users interact with layer-two networks or aggregated services. A single wallet can also represent many users, while one person can control several addresses. Analysts typically pair active address data with other indicators, such as exchange flows, realized losses, and long-term holder behavior, before drawing conclusions about market structure.
Still, the comparison to 2018-19 carries weight because that period marked one of Bitcoin’s most prolonged bear markets to date. Prices fell for months before finding a floor, and on-chain activity data was among the indicators later cited as having flagged the eventual bottom. Analysts referencing that precedent now are drawing attention to the similarity in current network behavior, while noting that macro conditions, regulatory context, and market structure differ from that earlier cycle.
The report frames the current reading as suggestive rather than conclusive. Bottoming signals derived from on-chain data have, in past cycles, sometimes preceded further price declines before an actual recovery took hold. Analysts interviewed in the report appear to treat the address data as one input among several, rather than a standalone signal of an imminent reversal.
Broader interest in on-chain metrics has grown as institutional participation in Bitcoin has expanded. Custody providers, exchanges, and asset managers increasingly reference network-level data alongside traditional market indicators when assessing risk and positioning. That shift has made metrics like active addresses more visible to a wider audience beyond dedicated crypto researchers.
Sources disagree on this story
This article was published before the reports below were compared. The reporting above stands; what follows is where the published accounts do not agree.
CryptoBriefing reports a recovery in Bitcoin active addresses by early August 2026, while Finbold and Cryptonomist report a fresh multi-year low on August 9, 2026, for the same metric and period.
What all sources agree on
- Bitcoin daily active addresses fell to levels last seen during the 2018-19 bear market.
- Finbold and Cryptonomist agree that active addresses were 545,233 on August 9, 2026, the lowest since 2018.
- Finbold and Cryptonomist agree the 30-day SMA of active addresses stood at 643,507 on August 9, down from 721,755 on October 6.
- Finbold and Cryptonomist agree Bitcoin traded at $64,960 at press time, down more than 25% year-to-date.
- Finbold and Cryptonomist agree the SMA(30) for active addresses has risen to its highest level since May 29, 2026.
Where the reports disagree
1Direction of active-address trend in early August 2026
By early August 2026, addresses had edged back up to a range of 660,000 to 675,000. A slight recovery, but still nowhere near the prior highs.
Bitcoin (BTC) has seen its active addresses plunge to the same level seen during the 2018/2019 crypto bear market. The Bitcoin Active Addresses, which tracks unique BTC addresses that have sent and received this asset each day, was at 545,233 on August 9, 2026, according to data from CryptoQuant, analyzed by Finbold on August 10.
Bitcoin active addresses dropped to 545,233 on August 9, 2026, the lowest reading since 2018.
What would settle it: The raw CryptoQuant on-chain active-address dataset for early August 2026.
2March 2026 low figure for daily active addresses
By March 25, 2026, that figure had compressed to 655,908, a level last seen during the protracted 2018-19 bear cycle.
As Bitcoin's active addresses (SMA 30) hovered at around 643,507 on August 9, the network's activity had tanked by 78,248, representing a 10.84% slide.
What would settle it: The raw CryptoQuant on-chain active-address dataset for March 2026 and comparison methodology (SMA vs. raw daily count).
What to make of it
Treat the 2018-19 comparison and the general narrative of reduced network activity as established across sources, but the specific direction of the trend in early August 2026 — recovery versus fresh low — is contested and should not be relied upon until the underlying CryptoQuant dataset is checked directly.
Market Impact
A drop in active addresses to multi-year lows could reinforce narratives among traders who track on-chain data for signs of market exhaustion. If historical parallels to 2018-19 hold, some analysts may treat the current reading as supportive of a stabilization thesis, though the report does not assert that a bottom has been confirmed.
Market participants who weight on-chain indicators heavily may adjust risk exposure based on this data, particularly if it is corroborated by other metrics such as exchange balances or long-term holder supply trends. However, the metric alone has historically not been a reliable standalone timing tool, and its predictive value tends to be assessed alongside price action and broader macro conditions.
The return of Bitcoin's active address count to 2018-19 levels has drawn attention from on-chain analysts weighing whether the current downturn is approaching exhaustion. The signal remains one data point among many, and confirmation of any bottom would likely require alignment across additional indicators.
Frequently Asked Questions
What does 'active addresses' measure in Bitcoin's network?
It counts the unique wallet addresses that send or receive transactions on a given day, serving as a rough proxy for network usage and speculative activity.
Why are analysts comparing current data to 2018-19?
Active address counts fell to similar levels during that bear market before Bitcoin's price eventually recovered, so some analysts see the current decline as a comparable pattern.
Does a drop in active addresses confirm a market bottom?
No. The report frames the data as suggestive rather than conclusive, and analysts typically combine it with other on-chain and market indicators before drawing firmer conclusions.
What limitations affect the active address metric?
The count can be skewed by exchange wallet batching, custodial structures, and layer-two activity, meaning it does not perfectly reflect the number of individual users.