

Bitcoin's price action has drawn renewed attention from traders watching a narrow band between $64,000 and $65,000. That zone is being described as a key pressure point where buyers and sellers are testing each other's resolve. Reports diverge slightly on the exact figures in play, but the broader theme is consistent. The asset is struggling to hold higher ground after a period of choppy trading.
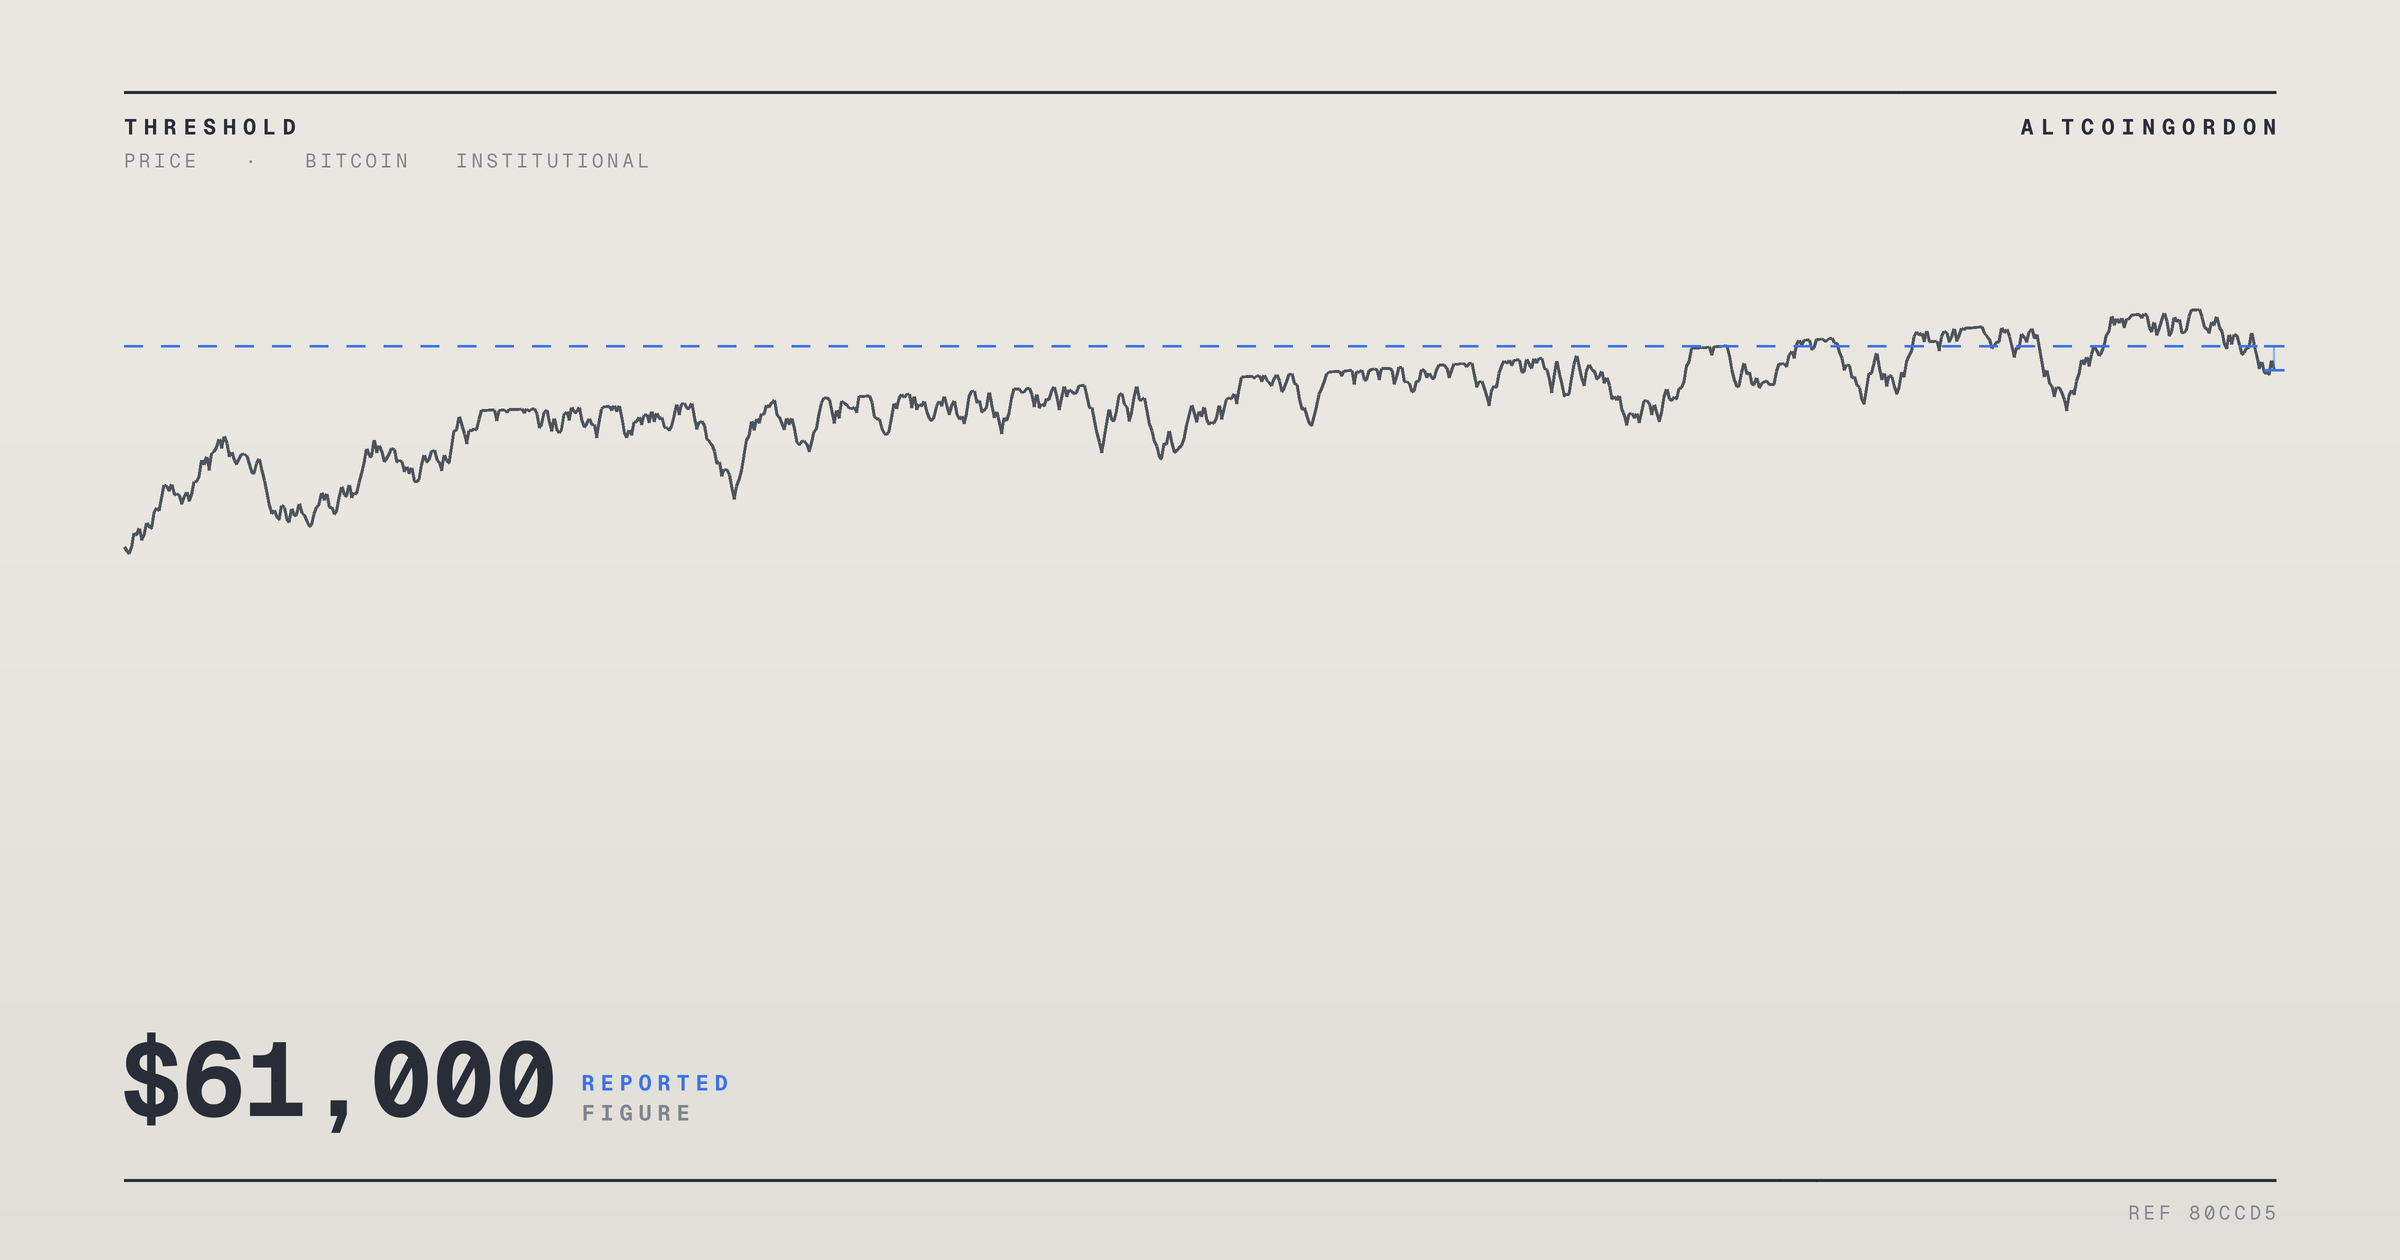
One set of observations points to $61,000 as the level traders are now targeting. This figure represents a potential support zone if the current range gives way. A drop to that level would mark a meaningful pullback from recent trading bands. It would also test the resolve of investors who bought at higher prices in recent weeks.
Other reporting frames the situation around a $64,000 to $65,000 pressure zone instead. This range is being watched as a line traders need to defend to avoid a deeper slide. The two figures are not necessarily contradictory. They may simply reflect different stages of the same potential downward move, with $64K-$65K as the first line of defense and $61,000 as the level that follows if that defense fails.
Market structure discussions like these are common during periods of consolidation. Bitcoin has spent recent sessions moving within a defined range rather than trending sharply in either direction. Traders often use technical levels like these to gauge sentiment and position size. Support and resistance zones do not guarantee future price behavior. They do, however, reflect where market participants have previously shown buying or selling interest.
The attention on these levels comes amid a broader backdrop of cautious sentiment across crypto markets. Macro conditions, regulatory developments, and shifts in institutional flows can all influence how these technical zones play out. No single indicator determines price direction on its own. Traders typically weigh multiple signals, including volume, order book depth, and broader risk appetite, before acting on any single support or resistance level.
It remains unclear which of the two ranges, $61,000 or $64,000 to $65,000, will prove more decisive in the days ahead. Market watchers are likely to continue monitoring both as bitcoin's price seeks direction. The coming sessions could clarify whether the current pressure resolves into a deeper pullback or a stabilization near current levels.
Market Impact
A confirmed break below the $64,000 to $65,000 zone could accelerate selling pressure toward the $61,000 support level cited by traders. Such a move would likely affect sentiment across altcoins, which often track bitcoin's broader price trend. Leveraged positions tied to these levels could also face liquidation risk if the range breaks decisively in either direction.
Conversely, a successful defense of the current range could ease near-term selling pressure and stabilize sentiment. Market participants will likely watch trading volume and order flow around these levels for confirmation of the next move. No outcome is guaranteed, and price action in the coming days will determine which scenario materializes.
Bitcoin's price remains at a technical crossroads, with traders watching both the $64,000 to $65,000 zone and the $61,000 support level for clues on the next move. The coming sessions should help clarify which range holds greater significance for the market's near-term direction.
Frequently Asked Questions
Why are traders watching $61,000 as a support level for bitcoin?
Some market observers have identified $61,000 as a potential support zone should bitcoin fail to hold its current trading range, based on recent price behavior.
What does the $64,000 to $65,000 range represent?
This range has been described as a pressure zone where buyers and sellers are contesting control, and where a breakdown could open the door to further declines.
Do the two reported price levels contradict each other?
Not necessarily. The $64,000 to $65,000 zone may represent an initial line of defense, with $61,000 serving as a secondary support level if that zone fails to hold.
Does a support or resistance level guarantee future price movement?
No. These levels reflect areas of past buying or selling interest but do not guarantee how price will behave going forward.