

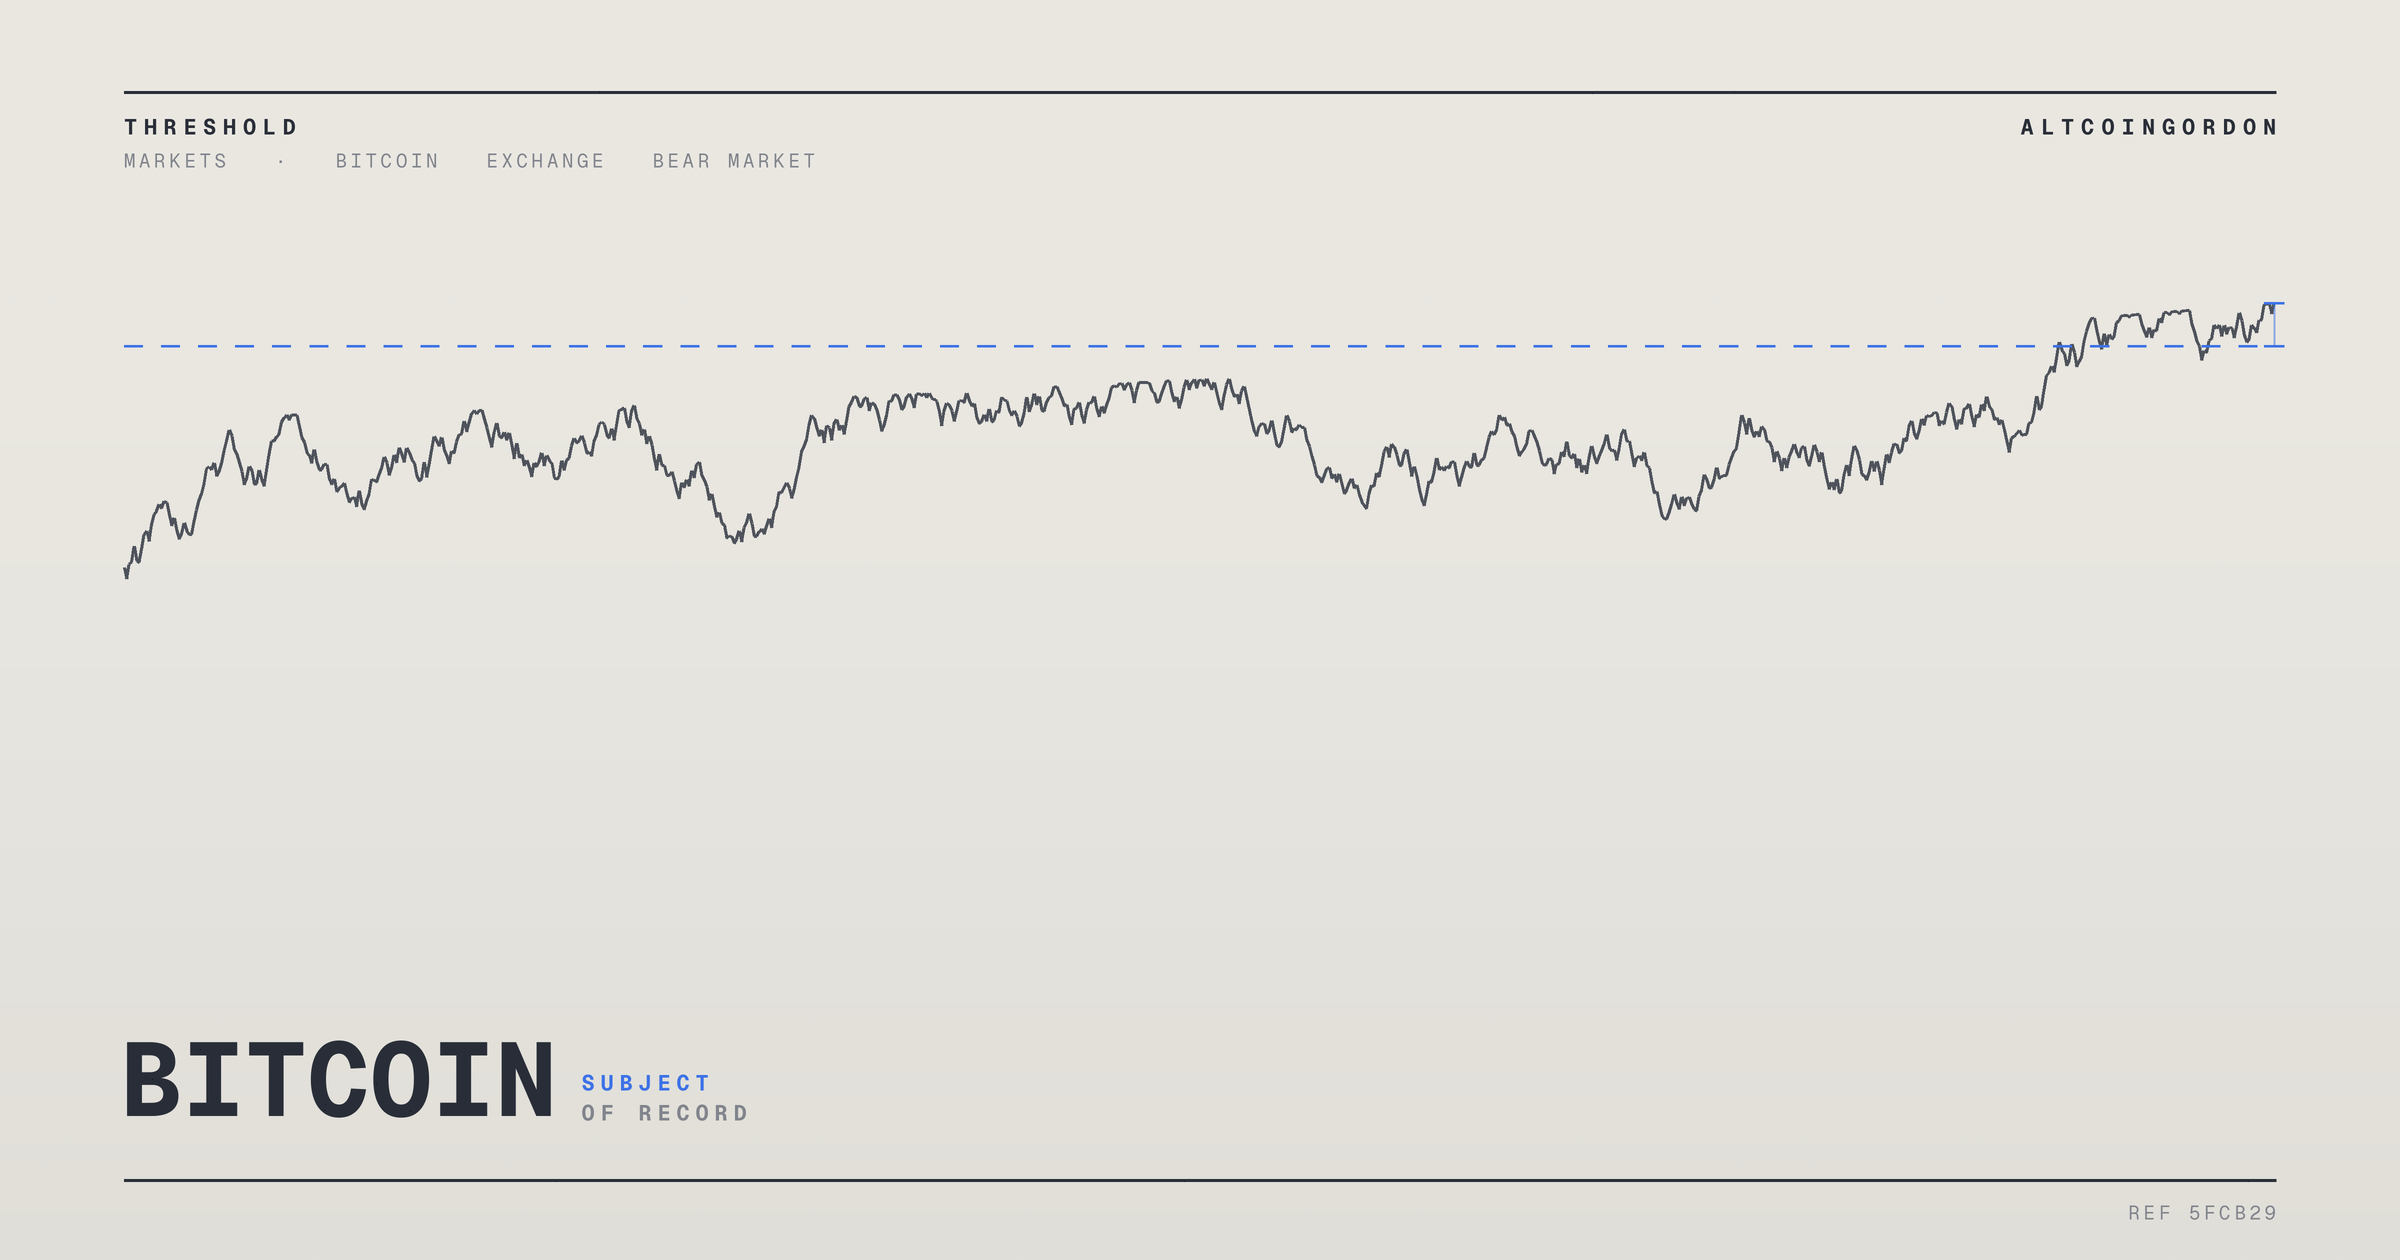
Bitcoin has climbed back above its 50-week moving average, according to reports from CoinDesk and Cointelegraph. The level is a widely followed technical indicator among traders who track long-term price trends. Both outlets noted that reclaiming this average has, in past cycles, coincided with the transition out of extended downturns.
The 50-week moving average smooths out weekly price data over roughly a year. It is often used to distinguish between bullish and bearish market phases. When Bitcoin trades below the line for a sustained period, it typically signals weakness or consolidation. A move back above it can suggest that buying pressure is starting to outweigh selling pressure over the medium term.
Cointelegraph framed the reclaim as a question worth asking directly: whether the bear market phase that has weighed on Bitcoin is now ending. CoinDesk described the crossing as a hurdle that has, in prior cycles, come before periods of significant price appreciation. Neither outlet offered a specific price target or timeline for what might follow.
Historical context matters here. Bitcoin has moved through multiple boom-and-bust cycles since its creation, each followed by extended stretches of subdued trading. Technical analysts have long used moving averages, including the 50-week line, as one of several tools to interpret where the market sits within these cycles. No single indicator has proven infallible, and past patterns do not guarantee future outcomes.
The timing of this reclaim is notable given the broader environment facing digital assets. Bitcoin has faced pressure over the past year from a mix of macroeconomic uncertainty, shifting interest rate expectations, and fluctuating investor appetite for risk assets. Institutional participation through exchange-traded products has also grown, changing how quickly capital can flow into and out of the market compared with earlier cycles.
Market participants often treat moving average crossovers as confirmation signals rather than standalone triggers. Traders frequently look for the level to hold over multiple weeks before treating a crossover as durable. A quick reversal back below the average would undercut the bullish reading that both outlets described.
It is also worth noting that technical indicators reflect price behavior, not the underlying causes driving it. Analysts studying this reclaim will likely look at trading volume, derivatives positioning, and broader liquidity conditions to assess whether the move has real staying power. Regulatory developments and macroeconomic data releases in coming weeks could also influence whether the signal holds.
For now, the reclaim of the 50-week moving average represents a data point rather than a confirmed trend reversal. Both CoinDesk and Cointelegraph presented it as historically significant while stopping short of declaring the bear market definitively over. That caution reflects the broader uncertainty still surrounding crypto markets heading into the final months of the year.
Market Impact
A confirmed reclaim of the 50-week moving average could encourage renewed interest from traders who use technical signals to time entries into the market. Historically, similar crossovers have been followed by periods of increased trading activity and price appreciation, though outcomes have varied across cycles.
At the same time, market participants are likely to watch whether Bitcoin can hold above this level in coming weeks. A failure to sustain the position could dampen sentiment and delay any broader shift in market structure that traders associate with the end of a bear phase.
Bitcoin's move above its 50-week moving average has drawn attention as a historically meaningful technical signal. Whether it marks a genuine turning point will depend on price action and broader market conditions in the weeks ahead.
Frequently Asked Questions
What is the 50-week moving average?
It is a technical indicator that averages Bitcoin's closing price over the previous 50 weeks, smoothing out short-term volatility to highlight longer-term trends.
Why do traders watch this specific indicator?
The 50-week moving average has historically aligned with shifts between bullish and bearish market phases for Bitcoin, making it a common reference point for cycle analysis.
Does this reclaim confirm the bear market is over?
No. Both outlets that reported the move described it as historically significant but stopped short of confirming that the bear market has definitively ended.
What could invalidate this bullish signal?
If Bitcoin's price falls back below the 50-week moving average for a sustained period, traders would likely view the earlier crossover as less reliable.