

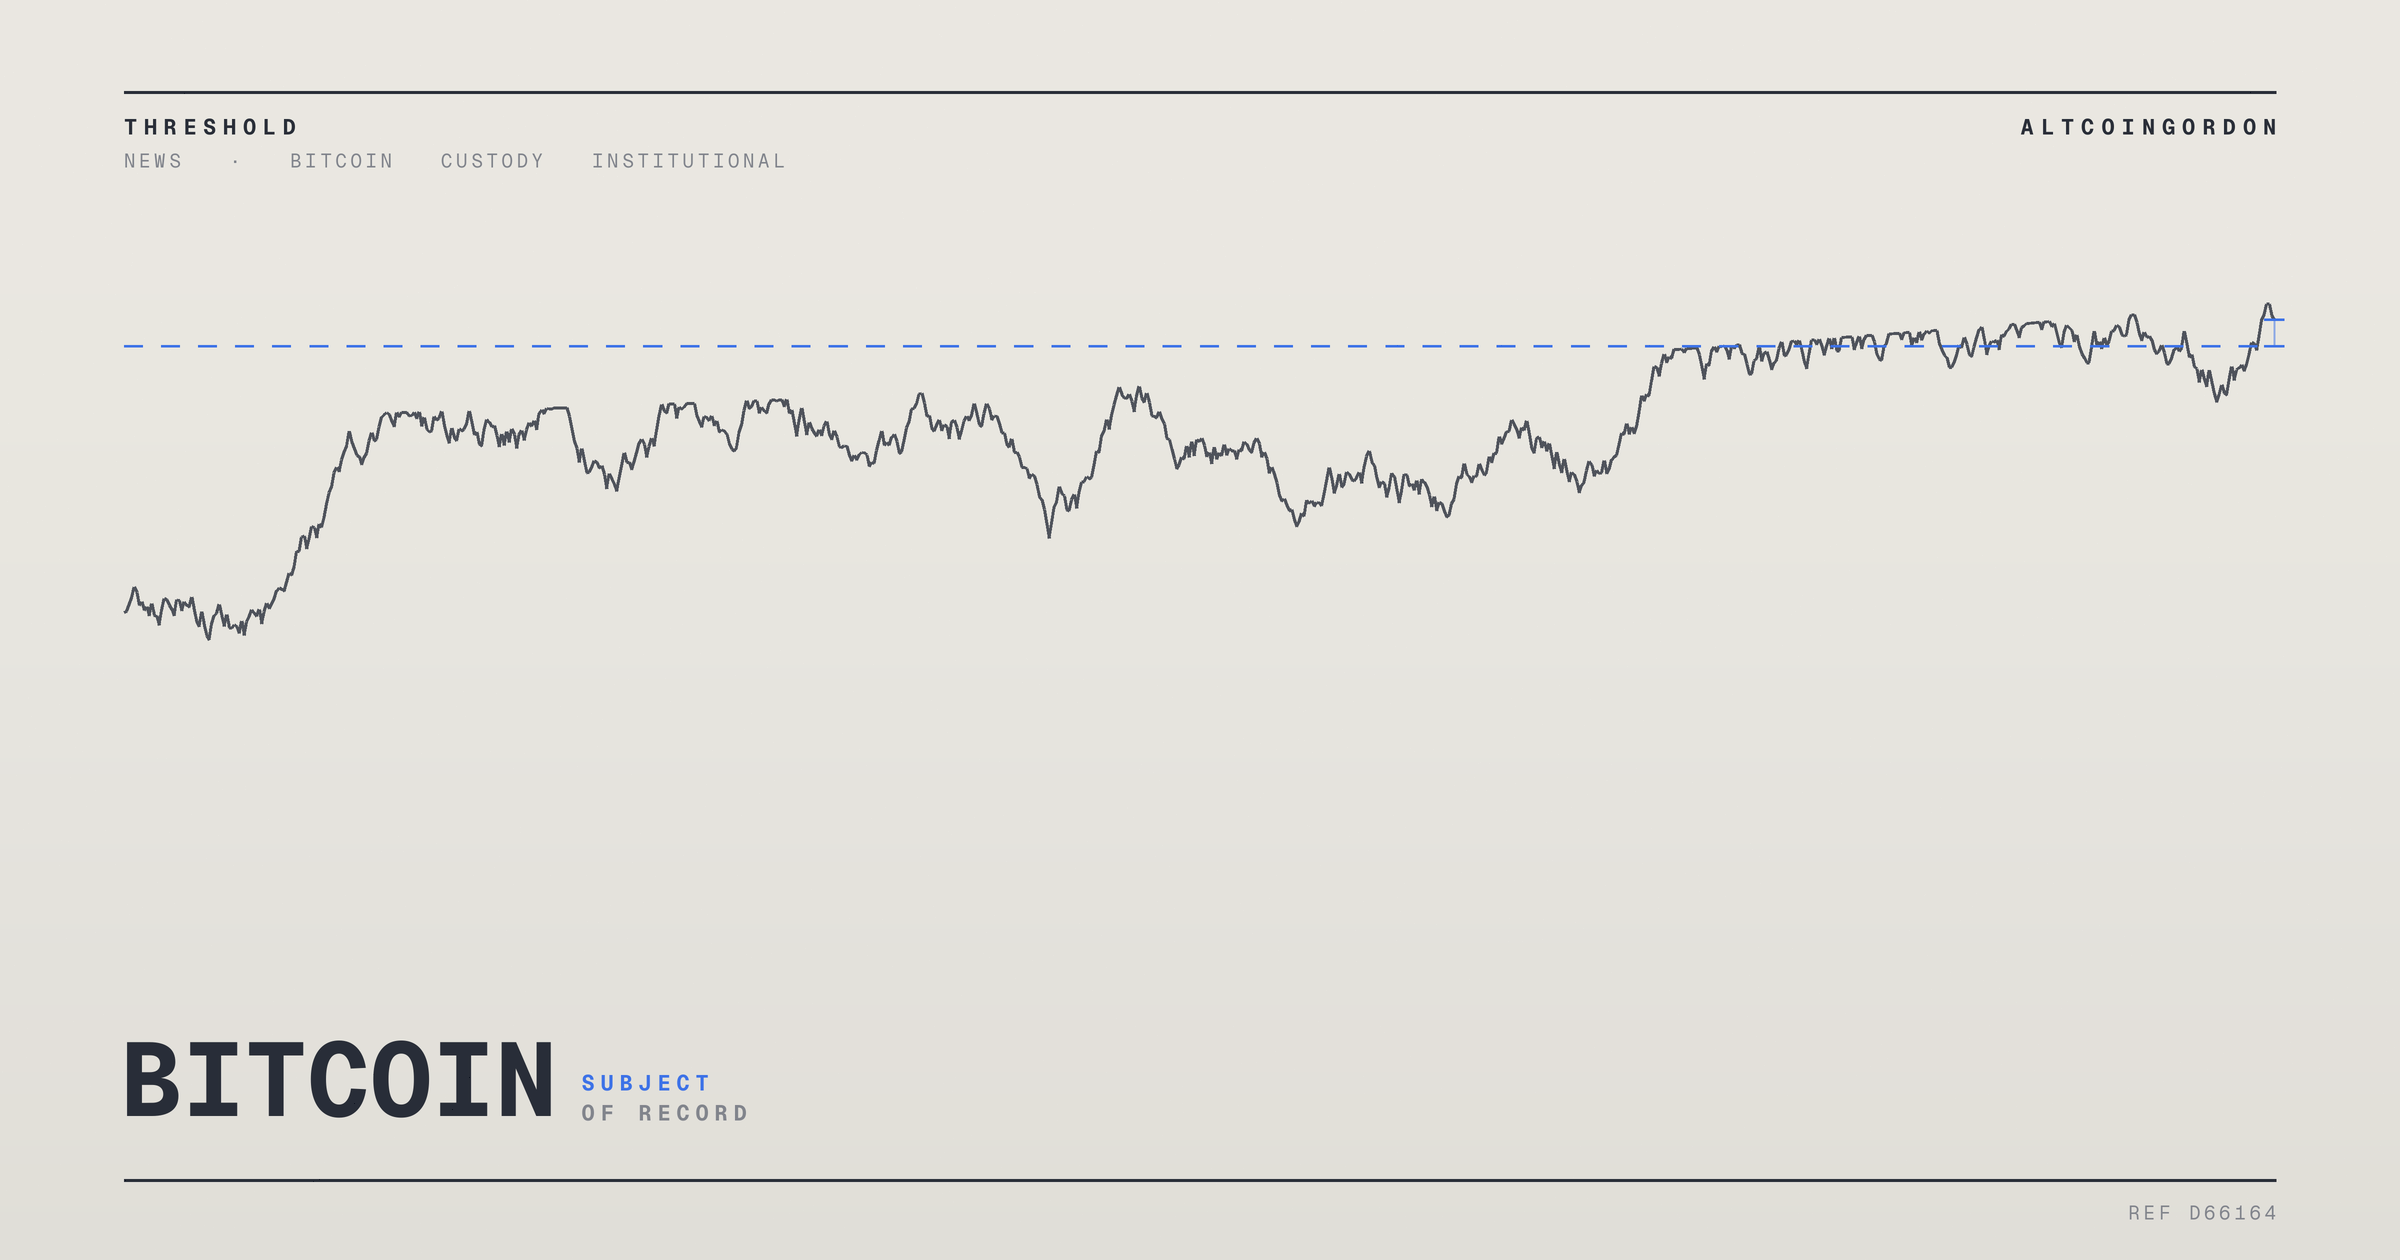
A technical signal that traders have used to identify multi-week lows in Bitcoin's price has reportedly broken down, according to BeInCrypto. The outlet described the development as notable because similar breaks occurred during the previous two market cycles, each time preceding significant price action.
The signal in question is tied to a seven-week window, a timeframe some analysts use to flag periods where selling pressure exhausts itself before a reversal. When such indicators hold consistently across cycles, traders often treat them as reliable markers for timing entries or exits. A break in the pattern can suggest either a shift in market structure or the start of a new phase in price behavior.
BeInCrypto's report places the current break in the context of Bitcoin's broader cyclical history. Bitcoin has moved through several multi-year cycles since its inception, each characterized by distinct phases of accumulation, rapid appreciation, and extended drawdowns. Technical signals like the seven-week bottom indicator have been used by analysts to map where the asset sits within that broader cycle.
It remains unclear from the available reporting what specific price levels or dates define the current break, or how it compares numerically to the prior two instances. BeInCrypto's account focuses on the pattern itself rather than granular price data, leaving open questions about magnitude and exact timing.
Market watchers often treat such historical comparisons cautiously. Past cycles unfolded under different macroeconomic conditions, regulatory environments, and levels of institutional participation. A signal that held during earlier, more retail-driven cycles may behave differently now that Bitcoin trades alongside a more mature derivatives market and greater institutional custody infrastructure.
Still, the recurrence of a pattern across two separate cycles has drawn attention among traders who track on-chain and technical indicators closely. Whether this latest break signals a similar outcome to prior instances, or reflects a structurally different market, is something only time and further price action will clarify.
Market Impact
If the pattern described by BeInCrypto holds any predictive value, traders who rely on cyclical technical signals may adjust their near-term expectations for Bitcoin's price behavior. Such signals are frequently incorporated into broader trading strategies alongside funding rates, options positioning, and macro indicators, rather than used in isolation.
Broader market reaction will likely depend on whether other analysts and data providers confirm similar observations in the coming days. Until then, the report should be treated as one data point within a wider mosaic of indicators that traders use to assess Bitcoin's position within its current cycle.
The reported break in this long-tracked bottom signal adds another data point for traders parsing Bitcoin's current cycle. As with any historical pattern, its predictive reliability will only become clear with time and additional confirmation.
Frequently Asked Questions
What is the seven-week bottom signal referenced in the report?
It refers to a technical pattern some analysts use to identify multi-week price bottoms for Bitcoin, based on a seven-week timeframe.
Why does a break in this signal matter?
According to BeInCrypto, similar breaks occurred during the two previous market cycles, which is why traders are paying attention to the current development.
Does this signal predict future Bitcoin prices?
The report describes a historical pattern rather than a guaranteed outcome. Past performance of technical indicators does not ensure similar results going forward.
What specific price levels triggered this signal break?
The available reporting does not specify exact price levels or dates, focusing instead on the pattern's historical recurrence.